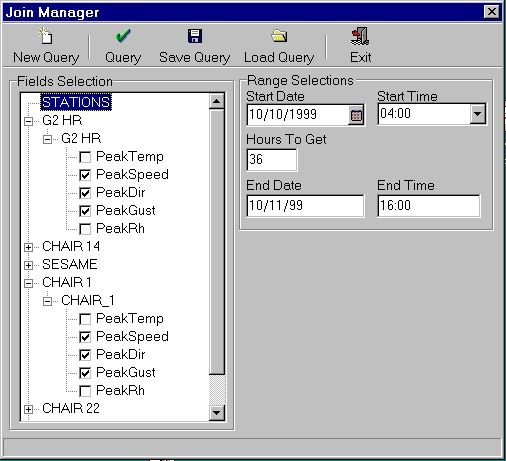
JoinManagerį is awesome. It allows you to
configure any data fields
in your network for report writing. This is also where you configure
graphic display of your data. You can combine any data fields you’d like to
display. Graphs created with each query can have up to five individual panels.
With the "Save Query" button, you can save the configured query and
name it whatever you’d like. Next time you need the same report,
just load the query, define the date and time range, and you’re ready to view!