Environmental Monitoring and Technology.
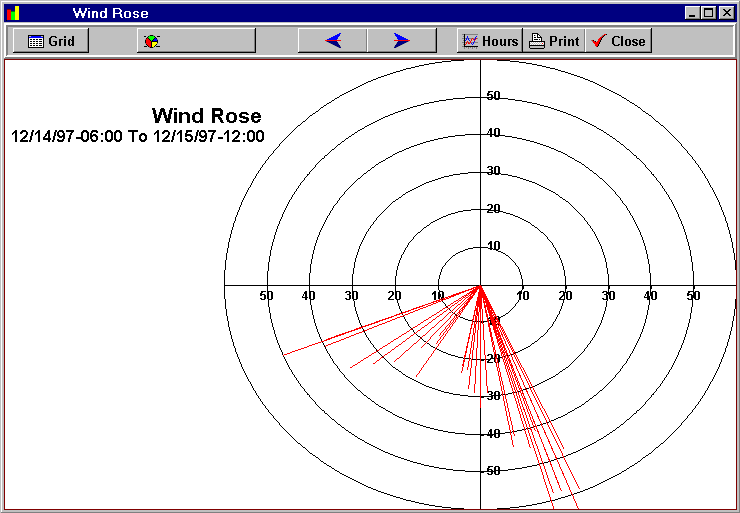
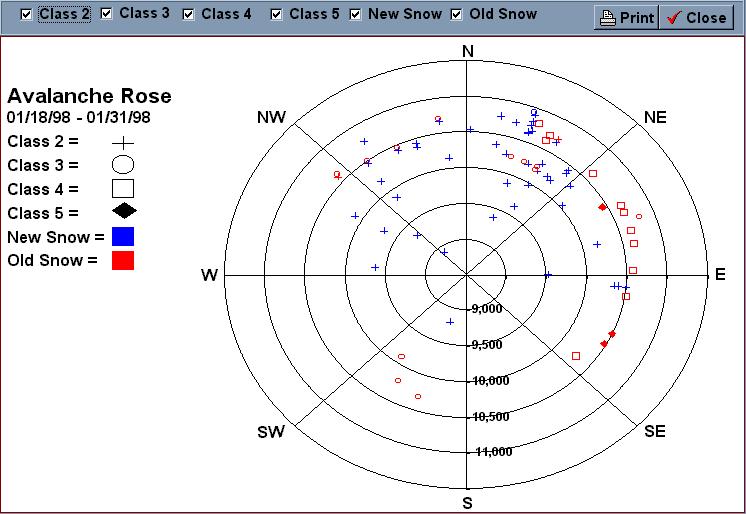


WB01540_.gif (632 bytes) SKYSCAN!!!!
Lightning Detector

WB01540_.gif (632 bytes)   SEARCH

 WB01540_.gif (632 bytes)   RECCO
Rescue System
                                        WB01540_.gif (632 bytes) APPLICATIONS   

WB01540_.gif (632 bytes) PRODUCTS

 WB01540_.gif (632 bytes)  SERVICES

WB01540_.gif (632 bytes) STROV SOFTWARE

 WB01540_.gif (632 bytes) ABOUT US

WB01540_.gif (632 bytes) PROJECTS

 WB01540_.gif (632 bytes) WHAT'S NEW!

WB01540_.gif (632 bytes) FEEDBACK

 WB01540_.gif (632 bytes) HOME


[Banner Image]


NoHow Software Products

No matter how much data you collect, it is not very valuable if you can't use it easily and efficiently. The Software we develop aides the process of discovering meaningful new correlation's, patterns and trends, by graphically displaying the large amounts of data projects often create.

No matter the type of data you create with the project, having it imported, managed, and archived, in a relational database is essential. Our goal is to automate as much of the collection, displaying, and archiving processes as possible.

This allows you to spend more time working with the data. Our software has been for use in inventory control, point of sales, and enviromental projects including weather, terrain, and snow avalanche studies.

Your project has unique requirements. That's why we optimize performance by managing software overhead, efficiency, and intuitive navigation through each application we create.

SCREEN SHOTS
[Dividing Line Image]

  • Storm Analysis Graph
    Graphs display % of wind direction during snowfall and precipitaiton periods. User defines the time range in the database for the report.
  • SQL Database Queries
    Easy "drop n' drag" interface to link databases together, choose specific fields, and apply filters.
  • Hourly Time Series
    Automated importing from Remote Data Acquisition Sites displaying environmental conditions.
  • Snow Temperature Time Profile
    Data collected hourly from a 360cm array of sensors is graphed with relation to total snow on the ground.
  • Weather and Avalanche Time Series
    Graph displays one month of data from two different databases. This graph is created with three "clicks" of a mouse!
  • Wind Rose
    Graph displays relationship of wind velocity and direction.
  • Avalanche Rose
    Graph displays relationship of avalanche type and size, with the terrain database fields of aspect and elevation.

Make sure to check out our new products under development!

[Dividing Line Image]

Information Request Form

Select the items that apply, and then let us know how to contact you.

Send product literature
Have a salesperson contact me

Name

Title

Company

Address

Comments

E-mail

Phone

[Dividing Line Image]
TERMS OF USE
Send mail to Webmaster with questions or comments about this web site.
Copyright © 2007 NoHow Inc.
Last modified: September 16, 2007