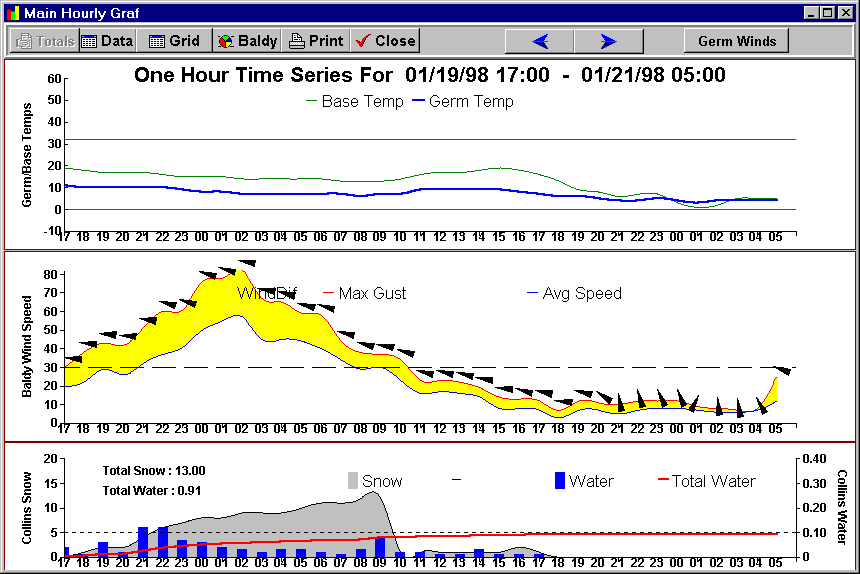
HOURLY TIME SERIES is
completely automated by ingesting remote data. The graph is designed for operational
purposes and has a maximum capacity of displaying 36 hours. Temperatures at two elevations
are in the top frame.
Wind velocity, direction, and maximum gust, are depicted on a "Wind Ribbon". The
arrows point into the wind. The hour
average velocity is the bottom line of the ribbon. The maximum gust is the top line. This
provides a unique look at the
wind patterns and trends. Different locations of wind data are graphed in the same window
by clicking a button. The
interval snowfall depth sensor is cleaned every 12 hours. Snowfall and precipitation
intensity are easily viewed. When
users navigate forward or backward in the defined time range, snowfall and water totals
are automatically recalculated.
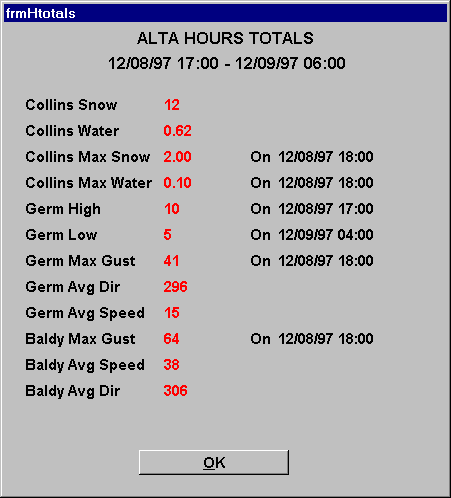
Any time range that is defined in the hourly graph,
produces totals,averages, and extremes from the weather data.